Data visualization has become the cornerstone of modern business intelligence, transforming how organizations extract meaning from their data. While countless data visualization tools flood the market, selecting the right platform can make or break your analytical initiatives. After eight years specializing in Data Visualization, I consistently guide clients toward one standout solution: Tableau.
Tableau's dominance isn't accidental—it represents the gold standard in data visualization capabilities and performance. Beyond its impressive speed and scalability, Tableau offers unparalleled flexibility for creating visual solutions to complex business challenges. Whether you're building simple bar charts or sophisticated interactive maps with extensive customizations, Tableau delivers professional results. Perhaps most compelling for budget-conscious teams, the robust Tableau Public version provides enterprise-level features at no cost.
How Does Tableau Compare to Other Tools?
The widespread enterprise adoption of Tableau stems from several key competitive advantages that address real-world business needs:
Speed
Time is money in data analysis, and Tableau excels at rapid visualization creation. Unlike traditional tools such as Microsoft Excel, which require manual formatting and chart construction, Tableau's intelligent algorithms automatically optimize your visualizations. This automation eliminates tedious formatting tasks, allowing analysts to focus on insights rather than mechanics.
The platform's drag-and-drop interface means you can transform raw data into publication-ready charts in minutes, not hours. For teams managing tight deadlines or frequent reporting cycles, this efficiency gain translates directly to competitive advantage.
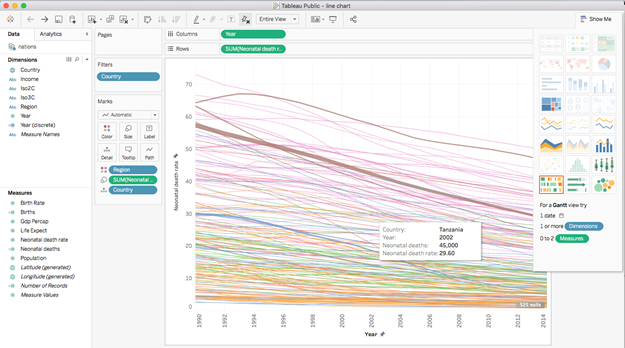
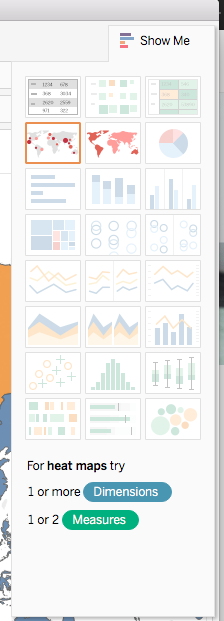
Pro Tip: Leverage Tableau's Show Me Panel to instantly preview optimal chart types for your selected data fields. This feature acts as your visualization consultant, suggesting the most effective ways to represent your specific data structure.
Powerful Integration
Modern organizations operate with diverse data ecosystems, and Tableau's connectivity reflects this reality. The platform seamlessly ingests data from virtually any source: Excel spreadsheets, CSV files, PDF tables, cloud databases, APIs, and enterprise data warehouses. This universality eliminates the data silos that plague many analytical workflows.
As cloud adoption accelerates in 2026, Tableau's native connectors to major platforms like AWS, Azure, and Google Cloud ensure your visualizations stay current with your infrastructure evolution. The platform also supports real-time data streaming, enabling live dashboards that reflect business conditions as they change.
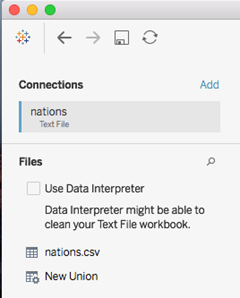
Expert Insight: Tableau's Data Interpreter function automatically detects and removes extraneous information from messy datasets—those header rows, footers, and formatting artifacts that typically require manual cleanup. One click transforms a cluttered spreadsheet into analysis-ready data.
Scalability
While Excel buckles under datasets exceeding one million rows, Tableau thrives with big data volumes that would crash traditional spreadsheet applications. This isn't merely about size—it's about maintaining performance and responsiveness as your data grows.
Tableau's architecture treats visualization as part of an integrated analytical ecosystem. Instead of jumping between Excel for analysis, PowerPoint for presentations, and separate tools for sharing, Tableau consolidates these functions into a cohesive workflow. Your analysis becomes your presentation becomes your interactive dashboard.
The platform's dashboard capabilities deserve special attention. Unlike static reports, Tableau dashboards respond dynamically to user interactions. Stakeholders can explore data independently, drilling down into specific segments or time periods without requesting new reports from your team. This self-service capability reduces your workload while empowering decision-makers with real-time insights.
Mobile-First Tip: Use Tableau's Device Preview feature during dashboard creation to ensure optimal viewing experiences across desktop, tablet, and mobile devices. With remote work remaining prevalent in 2026, responsive design isn't optional—it's essential.
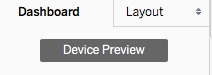
Tableau vs Excel: Key Differences
| Feature | Tableau | Microsoft Excel |
|---|---|---|
| Data Processing Speed | Intelligent algorithms | Manual formatting |
| Data Volume Capacity | Big data ready | Limited scalability |
| Visualization Types | Complex maps & custom charts | Basic charts |
| Integration Options | Multiple formats & databases | Primarily spreadsheets |
Tableau Advantages & Considerations
Quick Start Tips for Tableau
Use Show Me Panel
Select your data fields and browse through possible graph types using the Show Me Panel feature for rapid visualization creation.
Activate Data Interpreter
Clean imported tables automatically by using the Data Interpreter functionality to remove unnecessary information with a single click.
Preview Device Layouts
Click the Device Preview button to customize dashboards for desktop, tablet, or phone viewing with multiple layout options.
Getting Started with Tableau
Tableau's comprehensive feature set can initially feel overwhelming, particularly for professionals transitioning from simpler tools. The software's depth—while ultimately an asset—presents a learning curve that benefits from structured approach. Consider formal training to accelerate your proficiency and avoid developing inefficient habits that can persist for years.
A background in spreadsheet analysis provides excellent preparation for Tableau mastery. The logical thinking required for Excel formulas and pivot tables translates well to Tableau's calculated fields and data relationships. However, don't let spreadsheet inexperience deter you—Tableau's visual approach to data manipulation often proves more intuitive than formula-based alternatives.
Tableau's WYSIWYG (What-You-See-Is-What-You-Get) interface eliminates the guesswork common in other analytical tools. Changes appear immediately, allowing for iterative refinement and rapid experimentation. This visual feedback loop accelerates learning and builds confidence in your analytical capabilities.
The platform scales with your expertise, supporting everything from basic charts for newcomers to advanced analytics for seasoned data scientists. This scalability means your Tableau investment grows more valuable over time, rather than requiring platform migrations as your needs evolve.
Conclusion
While competitors like Excel continue enhancing their visualization capabilities, and newer entrants challenge specific niches, Tableau maintains its position as the comprehensive leader in data visualization. As organizations generate exponentially more data in 2026—from IoT sensors, customer interactions, and operational systems—the need for sophisticated visualization tools only intensifies.
Tableau's ecosystem offers solutions for every organizational context. Tableau Public provides full functionality for public-facing projects, while Tableau Desktop and Tableau Server deliver enterprise-grade security and governance for sensitive data. The Tableau Online cloud platform ensures accessibility regardless of your infrastructure preferences.
Your choice of visualization platform will influence your analytical capabilities for years to come. In an environment where data-driven insights determine competitive advantage, Tableau represents not just a tool purchase, but an investment in your organization's analytical future.
Resources
Preparation Checklist for Tableau Success
Familiarity with data analysis concepts will accelerate your Tableau learning curve
Structured courses help navigate Tableau's extensive feature set more efficiently
Practice with basic data before moving to complex big data projects
Take advantage of the visual interface to interact with data and create visualizations on the fly
Tableau Version Options
Tableau Public
Free version requiring online publication of visualizations. Perfect for learning and public data projects.
Tableau Desktop
Professional version for private work with full functionality and local file storage capabilities.
Tableau Server
Enterprise solution for organizational deployment with collaboration and sharing features.
Tableau's scalability makes it suitable for both novice analysts working with simple spreadsheets and experienced professionals handling big data projects.