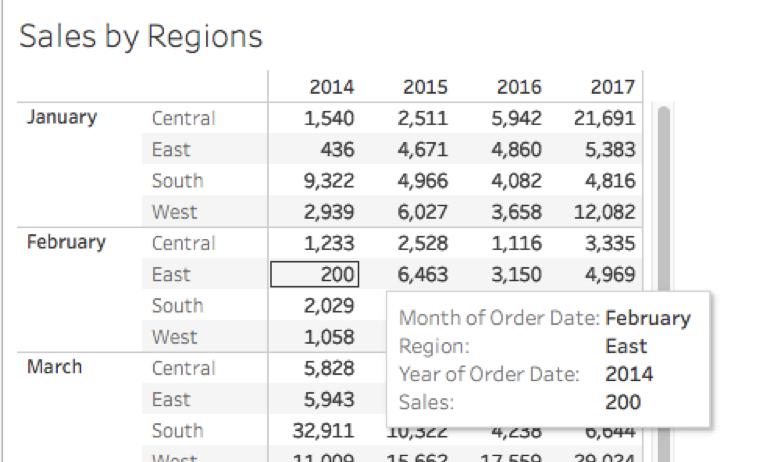
Figure 1.
What Are Table Calculations?
Table calculations represent one of Tableau's most powerful yet underutilized features for advanced data analysis. Unlike standard calculations that modify your underlying data, table calculations operate exclusively on the data currently visible in your view—what Tableau calls the fieldset. This local processing approach means you can perform sophisticated transformations without impacting your source data or requiring additional database queries.
The real strength of table calculations lies in their ability to create dynamic insights that adapt to your view's context. Whether you're building executive dashboards that show year-over-year growth percentages, creating performance rankings that update automatically as you filter data, or calculating running totals for financial reporting, table calculations provide the computational flexibility that separates basic visualizations from truly analytical dashboards.
How is the Table Calculation Performed?
Understanding how Tableau executes table calculations is crucial for creating reliable, predictable results. When you apply a table calculation, Tableau constructs a virtual "table" based on the dimensions currently in your view, treating this structure as the computational foundation. The system also considers any fields you've placed in the Detail shelf of the Marks card, as these expand the granularity of your underlying data table (highlighted in red in figure 2).
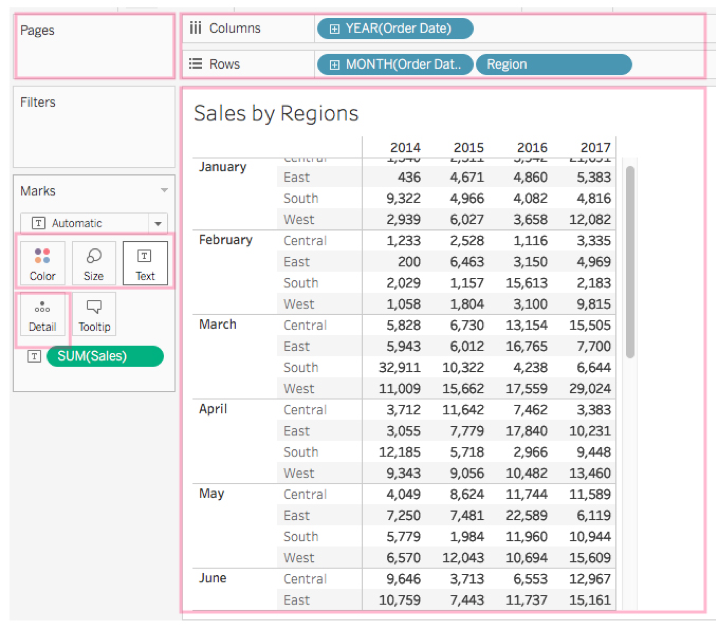
Figure 2.
The Table Calculation panel gives you precise control over both the calculation type and the computational direction within your data structure. For instance, selecting Table (across) instructs Tableau to compute horizontally across each row, restarting the calculation after every partition boundary, as demonstrated by the yellow highlighting in figure 3. This partitioning behavior is particularly important when working with grouped data, as it ensures calculations reset appropriately for each logical data segment.
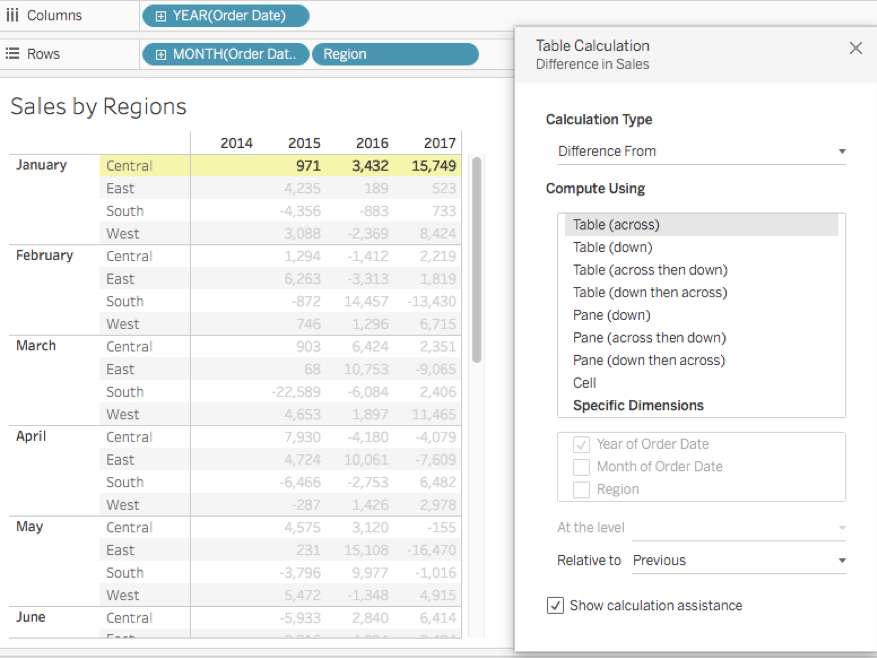
Figure 3.
Tableau offers comprehensive directional options for table calculations, including Table(down), Table(across then down), and Table(down then across). You can also scope calculations to pane level with options like Pane(down), Pane(across then down), and Pane(down then across). For maximum precision, you can compute at the cell level or restrict calculations to specific dimensions.
When you choose computation by "Specific dimension," Tableau reveals additional configuration options, allowing you to select target fields and define calculation levels when multiple dimensions are involved. Critically, any dimension you don't select for computation becomes a partitioning dimension, establishing the boundaries where calculations restart (figure 4). Advanced users can further refine behavior through "Relative to" settings and custom sort orders, providing granular control over calculation logic.
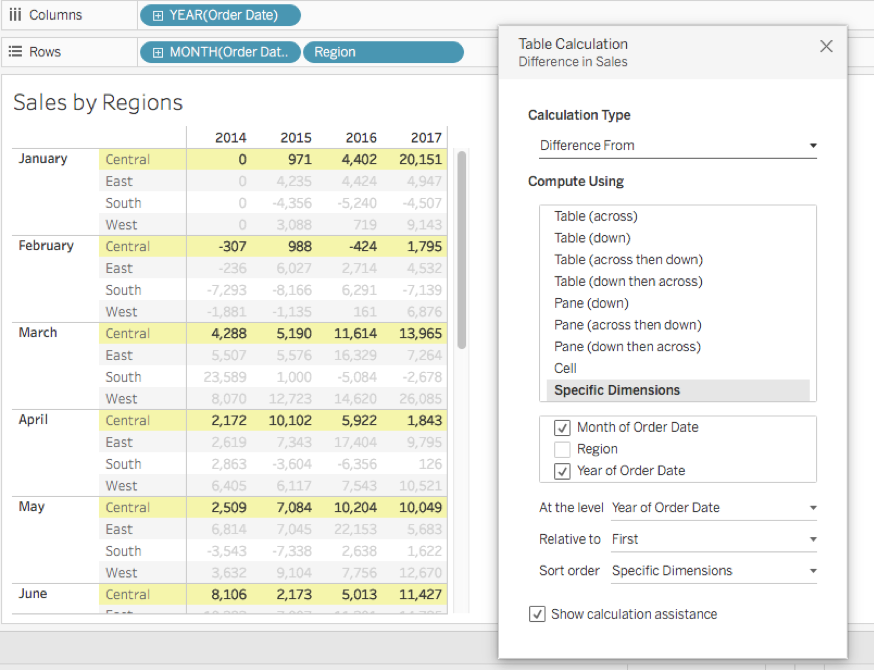
Figure 4.
Table vs Pane Computation Methods
| Feature | Table Computation | Pane Computation |
|---|---|---|
| Scope | Entire table structure | Individual pane sections |
| Restart Behavior | After every partition | Within each pane boundary |
| Best For | Cross-dimensional analysis | Localized calculations |
Setting Up Table Calculation Direction
Select Computation Type
Choose from Table (across), Table (down), Table (across then down), or Table (down then across) based on your analysis direction needs.
Configure Specific Dimensions
When selecting specific dimensions, choose fields for computation while unselected dimensions establish partition order for your calculations.
Adjust Advanced Settings
Fine-tune with Relative to and Sort order options to control exactly how calculations flow through your data structure.
The Different Types of Table Calculations
Tableau provides three distinct approaches for implementing table calculations, each suited to different workflow requirements and complexity levels. Mastering all three methods ensures you can choose the most efficient approach for any analytical scenario.
Quick Table Calculation
Quick Table Calculations serve as Tableau's gateway drug to advanced analytics—they're pre-built, immediately applicable, and perfect for rapid exploration or standard business metrics. These calculations appear in the right-click menu of any measure in your view, providing instant access to common computations like running totals, percentages of total, and moving averages. Simply right-click any pill in the shelves or Marks card and select Quick Table Calculation to see available options.
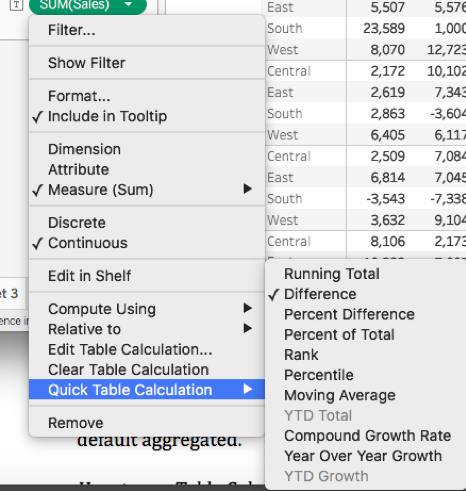
Figure 5.
What makes Quick Table Calculations particularly valuable is their reusability. After applying a calculation that delivers the results you need, you can preserve it for future use by dragging the calculated pill directly to the Data pane. Tableau automatically converts it into a persistent calculated field, making it available across all worksheets in your workbook.
Keep in mind that Quick Table Calculations operate exclusively on the data currently returned to your view, not your complete dataset. This view-dependency means the calculations will automatically adjust as you filter or modify your visualization—a feature that's either a blessing or a curse, depending on your analytical objectives.
Using the Calculation Editor
For analysts who need custom logic or want to combine multiple table calculation functions, the Calculation Editor provides complete flexibility. This approach is essential when Quick Table Calculations can't deliver the specific business logic your analysis requires.
Access the editor through the Analysis menu by selecting "Create calculated field" (figure 6). This opens Tableau's full calculation environment, where you can write custom formulas using any of Tableau's built-in functions.
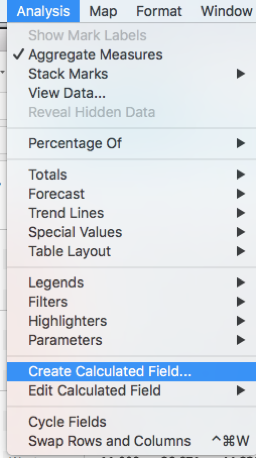
Figure 6.
Within the calculation panel, select Table Calculation from the function list to display all available table calculation functions. This view provides access to advanced functions like LOOKUP(), WINDOW_SUM(), and INDEX(), which form the building blocks for sophisticated analytical calculations.
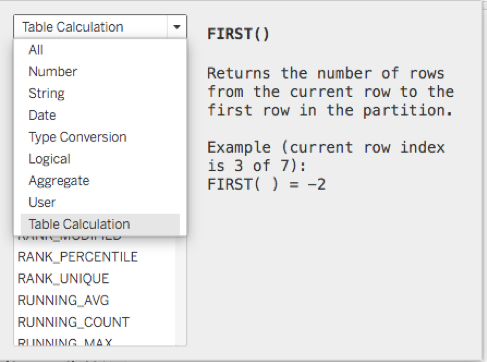
An important technical consideration: when manually writing table calculations, any dimension referenced in your formula requires explicit aggregation (typically SUM, MIN, or MAX) because Tableau aggregates data by default. This requirement often trips up users transitioning from other analytics platforms, but it ensures consistent behavior across different view configurations.
Figure 7.
Using Table Calculation Options
The Table Calculation Options dialog provides the most comprehensive control over calculation behavior, making it ideal for complex analytical scenarios that require precise configuration. This method bridges the gap between Quick Calculations and custom code, offering detailed settings without requiring formula writing.
Begin by connecting to your data source and creating a new worksheet with your desired fields arranged in the shelves. Right-click any measure in the Marks card and select Add Table Calculation to open the configuration panel. This approach gives you immediate visual feedback as you adjust settings, with Tableau highlighting affected cells in yellow to show exactly how your calculation will behave.
Within the Table Calculation dialog box (shown in Figures 3 and 4), start by selecting your Calculation Type—options include "Difference From," "Percent Difference From," "Running Total," and others. Next, configure Compute Using to define the calculation direction, such as Table (across) for horizontal computation. As you make these selections, the visualization updates in real-time, providing immediate validation of your calculation logic.
When you're satisfied with the results, click the "X" to close the panel. Your table calculation is immediately applied and will persist with the visualization. To modify the calculation later, right-click the field again and select "Edit Table Calculation" to reopen the configuration dialog.
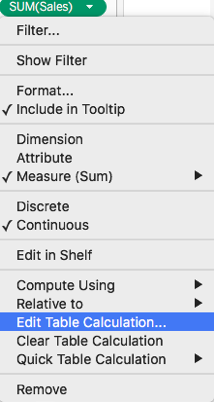
Figure 8.
If you need to remove a table calculation entirely, the same right-click menu provides a "Clear Table Calculation" option that instantly reverts the field to its original state.
Quick Table Calculations vs Manual Editor
Creating Custom Table Calculations
Access Calculation Editor
Navigate to Analysis menu and select Create calculated field to open the calculation panel with full editing capabilities.
Select Table Calculation Type
Choose Table Calculation to display the complete list of available calculation functions and options for your custom formula.
Apply Aggregation
Remember that dimensions require aggregation functions like SUM when manually written, as Tableau data is aggregated by default.
Table Calculation Setup Checklist
Ensure proper data connection before creating worksheets
Position fields correctly for your intended analysis structure
Access the Table Calculation panel for configuration options
Select the specific calculation method that matches your analysis goals
Set direction and scope with options like Table across or other methods
Use visual feedback to understand calculation flow through your data
Conclusion
Table calculations represent Tableau's most sophisticated analytical capability, transforming static visualizations into dynamic, context-aware analytical tools. In today's data-driven business environment, where stakeholders expect self-service analytics and real-time insights, mastering table calculations has become essential for any serious Tableau practitioner.
The versatility of table calculations extends far beyond basic mathematical operations. They enable advanced analytical patterns like cohort analysis, time-series forecasting, statistical outlier detection, and complex business metrics that would otherwise require extensive data preprocessing. As organizations continue to democratize data access in 2026, the ability to create these sophisticated calculations directly within Tableau—without involving data engineering teams—provides significant competitive advantages.
Whether you're starting with Quick Calculations to explore standard business metrics or building custom formulas for specialized analytical requirements, table calculations offer the flexibility to adapt to virtually any analytical scenario. The reusability features ensure that once you've developed effective calculation patterns, they can be leveraged across multiple analyses, making them a valuable investment in your organization's analytical infrastructure.
Resources
Table calculations provide sophisticated analytical capabilities while preserving your original data integrity, enabling complex insights within your current visualization context.
Key Benefits of Table Calculations
View-Specific Analysis
Perform calculations on exactly the data you're viewing without impacting underlying datasets or requiring data source modifications.
Reusable Components
Save and reuse table calculations across multiple worksheets and dashboards for consistent analytical approaches throughout your workbook.