What Are Parameters?
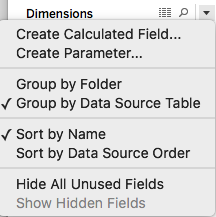
Parameters are dynamic variables that replace static values in calculations, filters, and reference lines, giving you unprecedented control over your data visualizations. Think of them as adjustable dials that let you modify your analysis in real-time without rebuilding your entire dashboard. To create a parameter, navigate to your data pane and click the arrow next to Dimensions, then select Create Parameter from the dropdown menu.
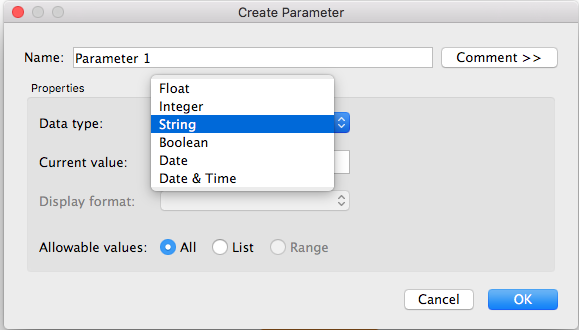
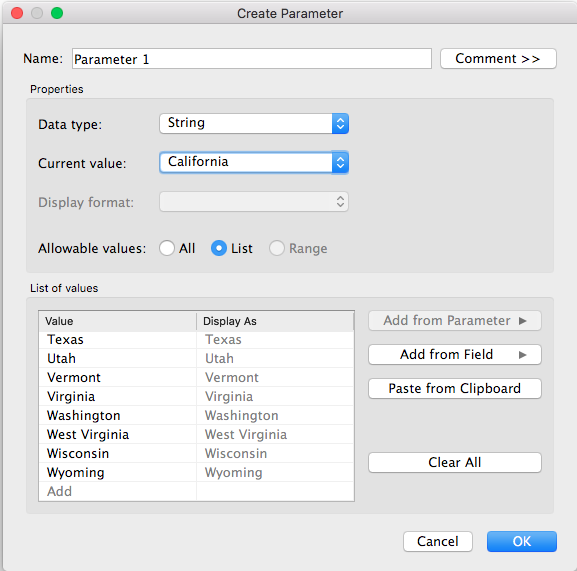
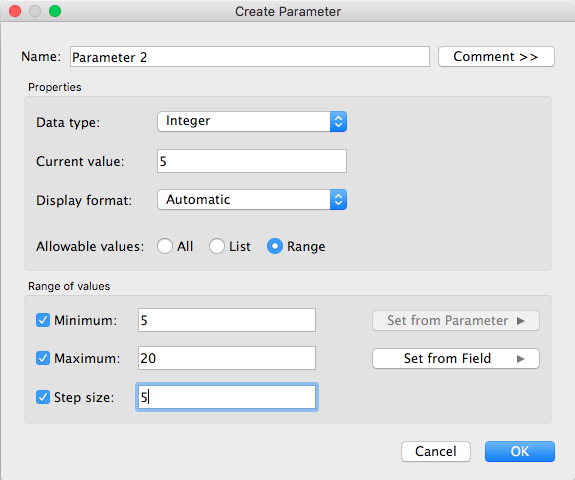
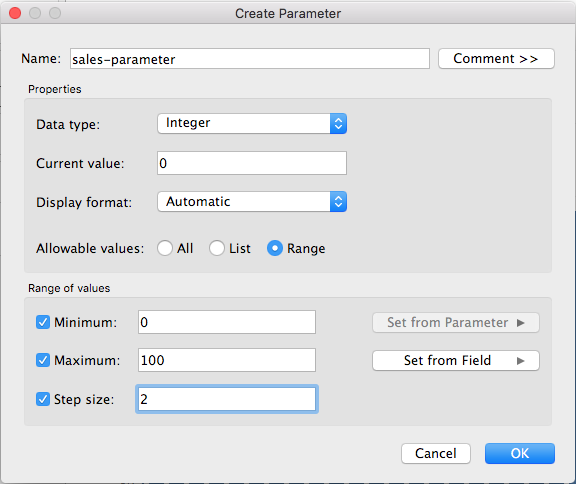
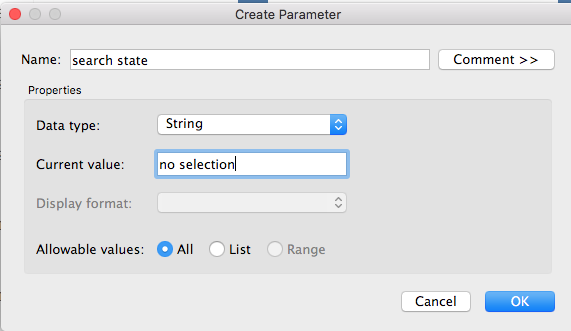
 This action launches the parameter configuration window, where you'll define the core characteristics of your parameter: the Name (choose something descriptive that your team will understand), the Data type (which determines what kind of values it can accept), and the default value (Current value) that will appear when users first interact with your visualization.
 Note: The Display format option is only available in Tableau Desktop.
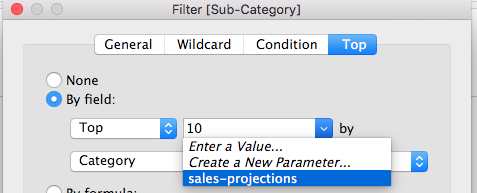
The Allowable value setting, which depends on your chosen data type, offers three powerful configuration options: All, List, or Range. Each option creates a distinctly different user experience through the Parameter Control interface:
- All—creates a flexible type-in field where users can enter any valid value, ideal for open-ended exploration
- List—provides a curated dropdown or selection list, perfect when you want to guide users toward specific, predefined choices
- Range—presents a bounded slider or input control, excellent for numerical data where you want to constrain values within logical limits
When selecting List, you'll need to populate your options manually or leverage the Add from Field feature to automatically pull unique values from an existing data field—a time-saving approach that ensures your parameter stays current with your data.
For Range parameters, you must define the boundaries by specifying the minimum, maximum, and step size values. The step size determines how granular your users' adjustments can be—smaller steps offer more precision but can make the control unwieldy for large ranges. You can also dynamically set these boundaries using field values, ensuring your parameter automatically adapts as your underlying data evolves.
 Once you've configured and created your parameter, it will appear in a dedicated Parameters section at the bottom of your data pane, clearly separated from your dimensions and measures for easy access.
Parameter Components
Name & Data Type
Define parameter identity and specify whether it handles strings, numbers, dates, or boolean values.
Current Value
Set the default value that appears when users first interact with your visualization.
Allowable Values
Control user input through All (free entry), List (predefined options), or Range (bounded values) settings.
Parameter Control Types
| Feature | Control Type | User Interface | Best Use Case |
|---|---|---|---|
| All | Type-in field | Maximum flexibility needed | |
| List | Dropdown or radio buttons | Predefined options required | |
| Range | Slider control | Numerical ranges with boundaries |
How to Use Parameters
Here's a crucial concept that often trips up new Tableau users: parameters are inert by themselves. They won't change your visualization until you actively incorporate them into calculations, filters, or reference elements. Think of a parameter as a variable waiting to be called into action. The real magic happens when you replace hard-coded constant values with your parameter, instantly transforming static analysis into dynamic, interactive exploration. This approach allows end users to adjust thresholds, modify calculations, or change filter criteria without needing to rebuild the visualization.
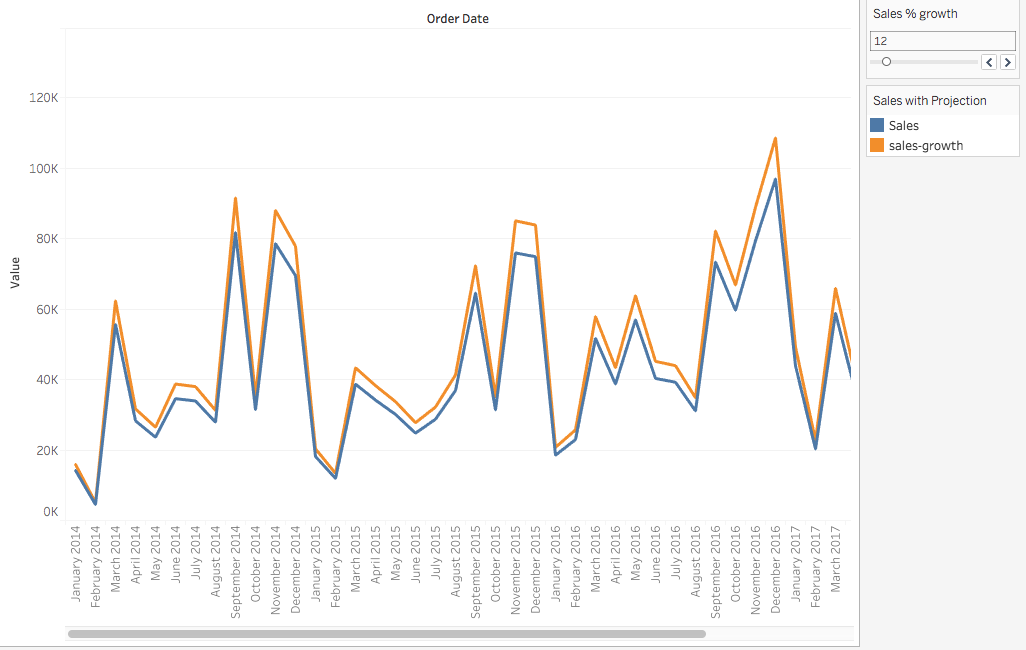
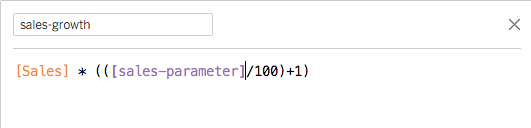
In the example below, we've created a parameter called "sales-parameter" and integrated it within a calculated field. Notice how this setup allows users to dynamically adjust the sales threshold, immediately updating the visualization to reflect their chosen criteria.
Parameters alone cannot change visualizations. They must be incorporated into calculations, filters, or reference lines to have any effect on your dashboard.
Parameter Implementation Workflow
Create Parameter
Define the parameter with appropriate data type and allowable values in the data pane.
Integrate with Formula
Replace constant values in calculations, filters, or reference lines with your parameter.
Show Parameter Control
Make the parameter visible to users by enabling the parameter control interface.
Test Dynamic Updates
Verify that changing parameter values automatically updates your visualization as expected.
Using Your Parameter in a Calculation
Integrating parameters into calculated fields is where you'll unlock their true potential for interactive analysis. Start by accessing your calculated field through a right-click and selecting "edit calculated field." Once inside the formula editor, simply drag your parameter from the data pane directly into your formula, replacing any static value you want to make dynamic. This drag-and-drop approach ensures proper syntax and reduces the risk of typing errors. When you modify your parameter's value later, Tableau automatically propagates that change throughout your formula, instantly updating any visualizations that depend on this calculation.
Adding Parameters to Calculated Fields
Open Calculated Field
Right-click on your existing calculated field and select 'Edit calculated field' from the context menu.
Drag Parameter
Locate your parameter in the data pane and drag it directly into your formula to replace constant values.
Update Values
Edit parameter values and observe automatic formula updates that reflect changes in your visualization.
Using Your Parameter in a Filter
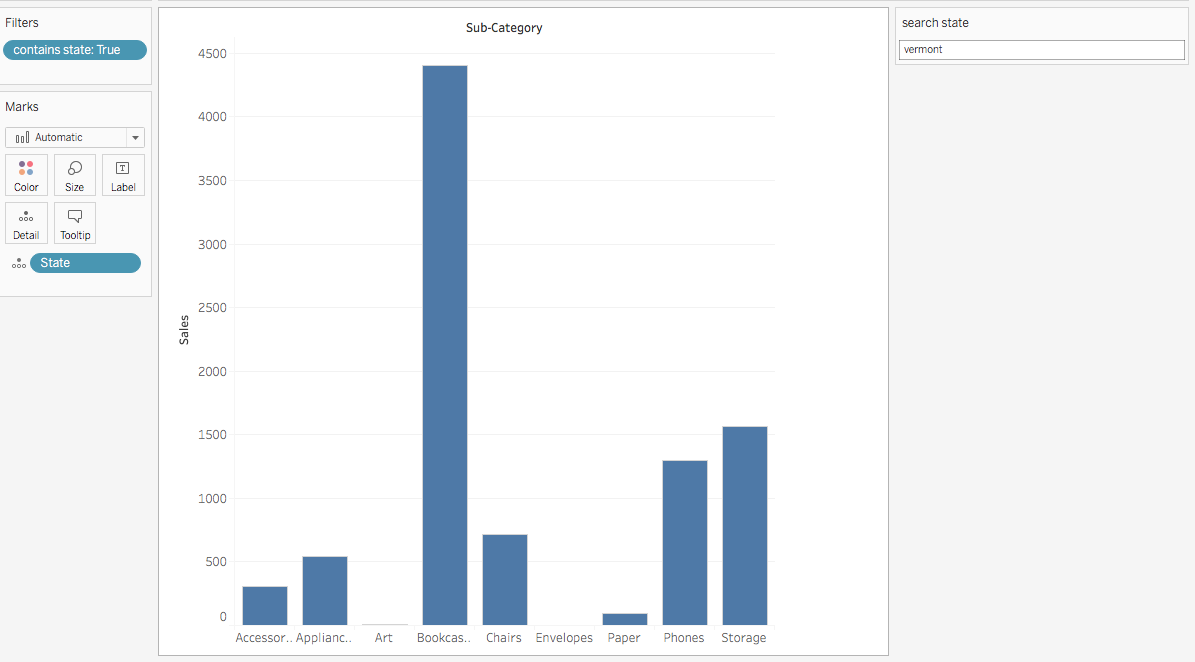
Parameters excel at creating sophisticated, user-controlled filtering experiences that go far beyond standard filter dropdowns. In the example above, we've constructed a state-based filter system using a parameter that allows users to type in state names and see corresponding sales data. This approach is particularly powerful when dealing with large datasets where traditional filter lists become unwieldy. The parameter drives a calculated field that dynamically evaluates which records match the user's input criteria, using functions like Contains to provide flexible, partial matching capabilities.
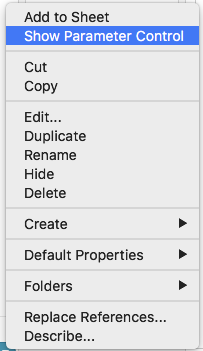
To implement this pattern, start by creating your parameter with appropriate settings for your use case. Next, make the parameter accessible to users by right-clicking it in the Data pane and selecting Show Parameter Control—this creates the interactive element users will see on your dashboard.
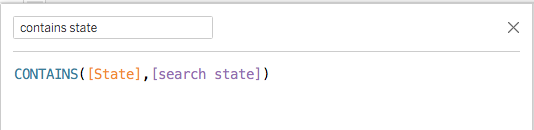
The next step involves creating a calculated field that references your parameter to evaluate your data. This calculated field acts as the bridge between user input and your filtering logic, translating parameter values into Boolean results that Tableau can use for filtering.
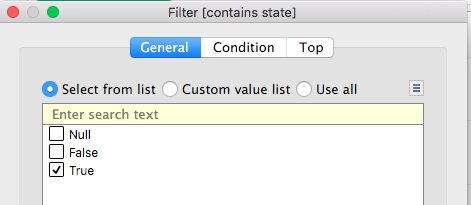
Finally, drag your calculated field to the Filters shelf and configure it to show only "True" values. This setup ensures that only records matching your parameter-driven criteria appear in the visualization, creating a seamless, responsive filtering experience.
Dynamic Filter Implementation
Create State Parameter
Set up a parameter to capture user input for state selection with appropriate data type configuration.
Show Parameter Control
Right-click the parameter in the data pane and select 'Show Parameter Control' to make it user-accessible.
Build Calculated Field
Create a calculated field that uses the parameter to control filter values dynamically.
Apply to Filter Panel
Drag the calculated field to the filter panel and configure the filter settings appropriately.
Using Reference Lines with Parameters
Parameters transform static reference lines into dynamic analytical tools that adapt to your users' needs in real-time. When you configure a reference line to use a parameter value, you're creating an interactive benchmark that stakeholders can adjust to explore different scenarios or thresholds. The reference line automatically repositions itself based on the parameter's current value, making it invaluable for sensitivity analysis, goal-setting exercises, or comparative studies. This functionality is particularly powerful in executive dashboards where leadership needs to quickly visualize how different targets or thresholds would impact performance metrics across the organization.
Parameters enable reference lines to move dynamically based on user input, providing interactive threshold analysis and comparative benchmarking capabilities.
Parameter Control
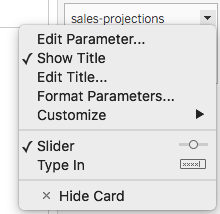
The parameter control interface offers extensive customization options that can dramatically improve your dashboard's user experience. Unlike basic filter controls, parameter controls are highly portable—you can include the same control across multiple sheets and dashboards, ensuring consistent user interaction patterns throughout your analytical ecosystem. This consistency is crucial in enterprise environments where users need to navigate complex analytical workflows efficiently.
Access the parameter control options by clicking the dropdown arrow on your parameter to reveal its configuration menu.
You'll discover multiple display options including radio buttons for discrete choices, compact lists for space efficiency, sliders for continuous ranges, or type-in fields for maximum flexibility. The available options intelligently adapt based on your parameter's data type and allowable value settings, ensuring the interface always matches your analytical intent. Choose radio buttons when you want to emphasize specific options, sliders for intuitive range selection, or type-in fields when precision is paramount.
 Note: Parameters maintain global scope across your entire workbook, making them accessible in any worksheet while ensuring consistent behavior. You'll also find them conveniently listed in the top section of filter dialog boxes, streamlining your development workflow.
Remember that parameters create cascading updates—any modification to a parameter value instantly propagates through every formula, filter, and reference element that depends on it, ensuring your entire analytical framework remains synchronized and current.
Parameter Control Display Options
Radio Buttons
Best for limited options where all choices should be visible simultaneously. Provides clear visual selection state.
Compact List
Efficient for moderate option counts. Saves dashboard space while maintaining easy access to all values.
Slider Control
Ideal for range parameters where users need to select values along a continuum with visual feedback.
Type-in Field
Maximum flexibility for users who know exact values. Suitable for open-ended parameter configurations.
Parameters are set globally across all worksheets in your workbook. Any edit to a parameter will update every formula, filter, and reference line that uses it.
Going Further: Using Parameter Actions
The evolution of parameters reaches its pinnacle with parameter actions, a sophisticated feature that transforms passive dashboards into truly interactive analytical experiences. In an upcoming article, we'll dive deep into parameter actions, which allow users to modify parameter values through direct interaction with dashboard elements—clicking on chart marks, selecting map regions, or highlighting table rows. This capability eliminates the traditional barrier between data consumption and data exploration, enabling stakeholders to intuitively drill down into insights without requiring technical knowledge of parameter controls. Parameter actions seamlessly integrate with reference lines, complex calculations, advanced filters, and even SQL queries, opening up possibilities for creating context-aware dashboards that respond intelligently to user behavior and deliver personalized analytical experiences.
Parameter Actions Learning Path
Master Basic Parameters
Complete understanding of static parameter creation and implementation
Explore Parameter Actions
Learn to control parameter values through direct dashboard interaction
Advanced Integration
Implement parameter actions with SQL queries and complex visualizations