Building on our previous exploration of Tableau's mapping capabilities, we've established that successful data visualization hinges on one critical requirement: geographical coordinates. Whether you're plotting global sales territories, tracking supply chain logistics, or analyzing demographic trends, Tableau must understand the precise location of every data point on your map.
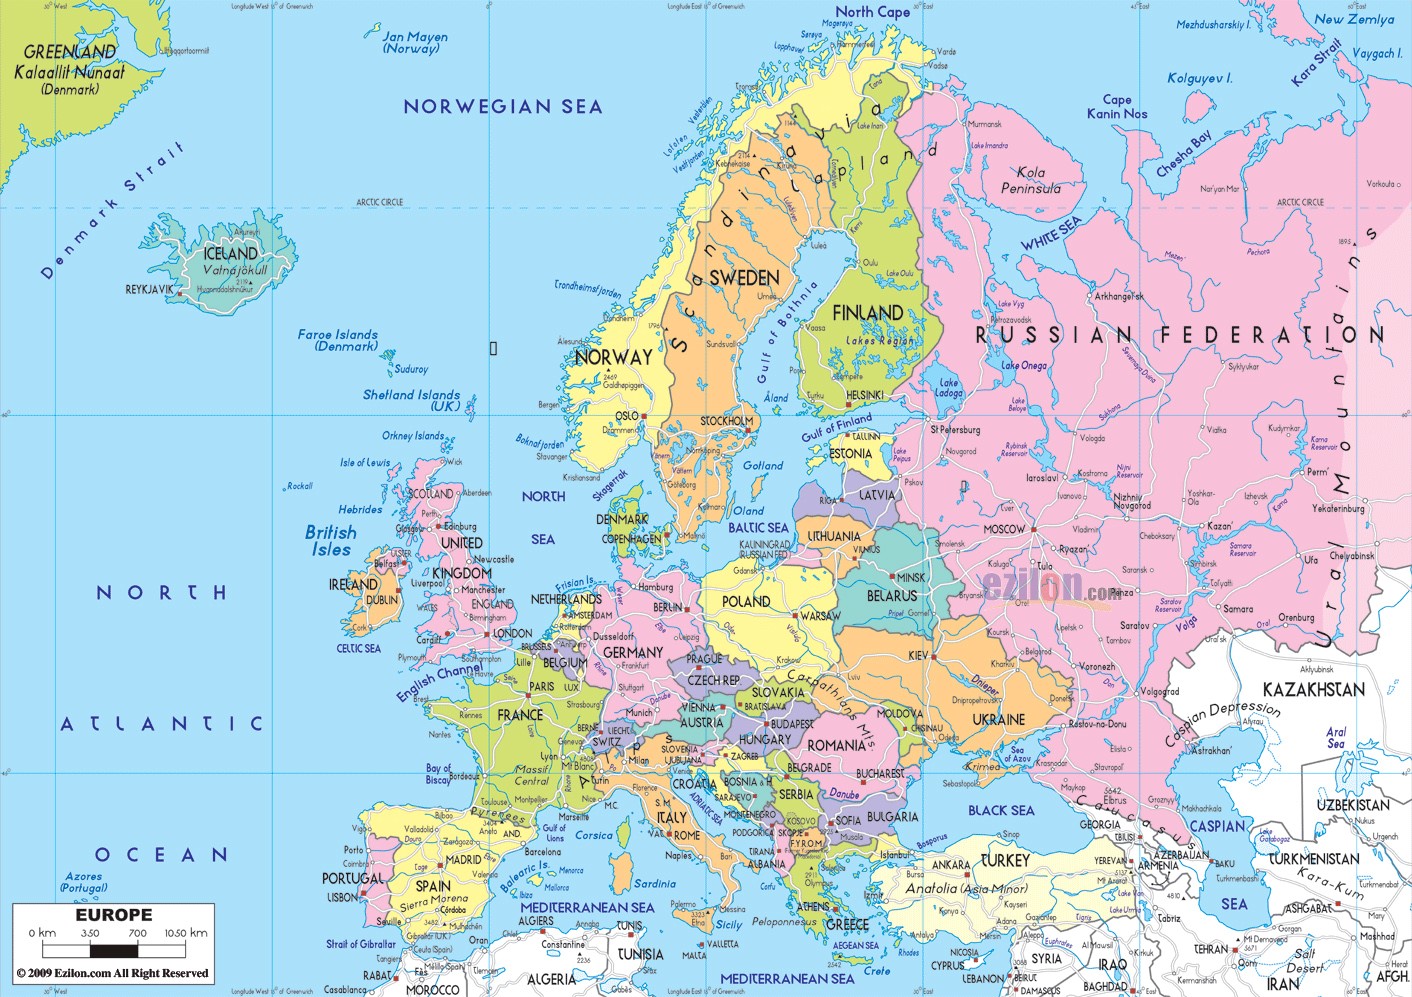
However, standard base maps often overwhelm your visualization with unnecessary detail. Consider the typical political map below—while comprehensive, it clutters your analysis with irrelevant cities, rivers, and topographical features that distract from your core data story. For most business applications, you need clean, simplified boundaries that serve as an unobtrusive canvas for your insights. This is precisely where GIS spatial files transform your mapping strategy, offering the flexibility to choose exactly what geographical context your data requires.
Leveraging Spatial Files for Professional Mapping
Spatial files represent the professional standard for geographic data visualization. These Geographic Information System (GIS) files are the same format used by government agencies, urban planners, epidemiologists, and Fortune 500 companies worldwide—making high-quality geographic data readily accessible for your business intelligence needs. Unlike static map images, spatial files contain rich geometric data that Tableau can manipulate, style, and layer with your business metrics.
Tableau supports four primary spatial file formats:
- Shapefiles — The industry standard, developed by Esri and widely adopted across organizations
- MapInfo TAB files — Professional-grade format popular in telecommunications and utilities
- KML (Keyhole Markup Language) files — Google Earth's native format, excellent for sharing and web integration
- GeoJSON files — Lightweight, web-friendly format increasingly used in modern applications
These files define geographic features through three fundamental geometric elements: points (for cities or store locations), lines (for transportation networks or boundaries), and polygons (for territories, districts, or administrative regions). In business contexts, polygons prove particularly valuable—they allow you to aggregate and visualize data across meaningful geographic areas, from sales territories to market penetration analysis.
Sourcing High-Quality Spatial Data
Professional-grade spatial files are more accessible than ever, with government transparency initiatives and open data movements providing unprecedented access to authoritative geographic datasets. The key is knowing where to look and understanding data quality indicators.
Recommended sources for business applications:
Esri Open Data Hub — Comprehensive datasets from thousands of organizations worldwide
Natural Earth Data — Cartographer-friendly data at multiple scales and resolutions
OpenStreetMap — Community-maintained, highly detailed global datasets
Terra Populus — Academic-quality demographic and environmental data
Critical technical note: Most spatial file formats require multiple supporting files to function correctly. For Shapefile implementations, you must download the complete file package containing the geometry (.shp), spatial index (.shx), and attribute (.dbf) files. Missing any component will prevent Tableau from properly reading your spatial data. Always download the entire folder structure provided by your data source.
Establishing Your Spatial Connection
Connecting to spatial files follows Tableau's standard data connection workflow, but with specific considerations for geographic data validation and projection handling.
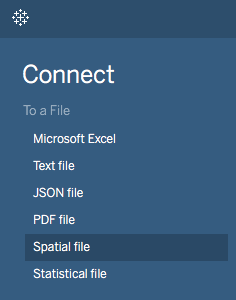
Navigate to Connect > Spatial file in Tableau's connection panel:
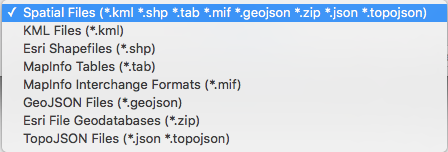
Browse to your spatial file location and select the primary file (typically the .shp file for Shapefiles):
Upon successful import, Tableau automatically processes the geometric data, converting complex polygon coordinates into latitude and longitude values while creating a special Geometry field. This field becomes your primary mapping element—simply double-click it to render your custom geographic foundation. Tableau handles coordinate system transformations seamlessly, ensuring your spatial data aligns correctly with any additional layers you may add.
Integrating Business Data with Geographic Context
The power of spatial files emerges when you overlay your business metrics onto these custom geographic boundaries. Your approach depends entirely on the story your data needs to tell.
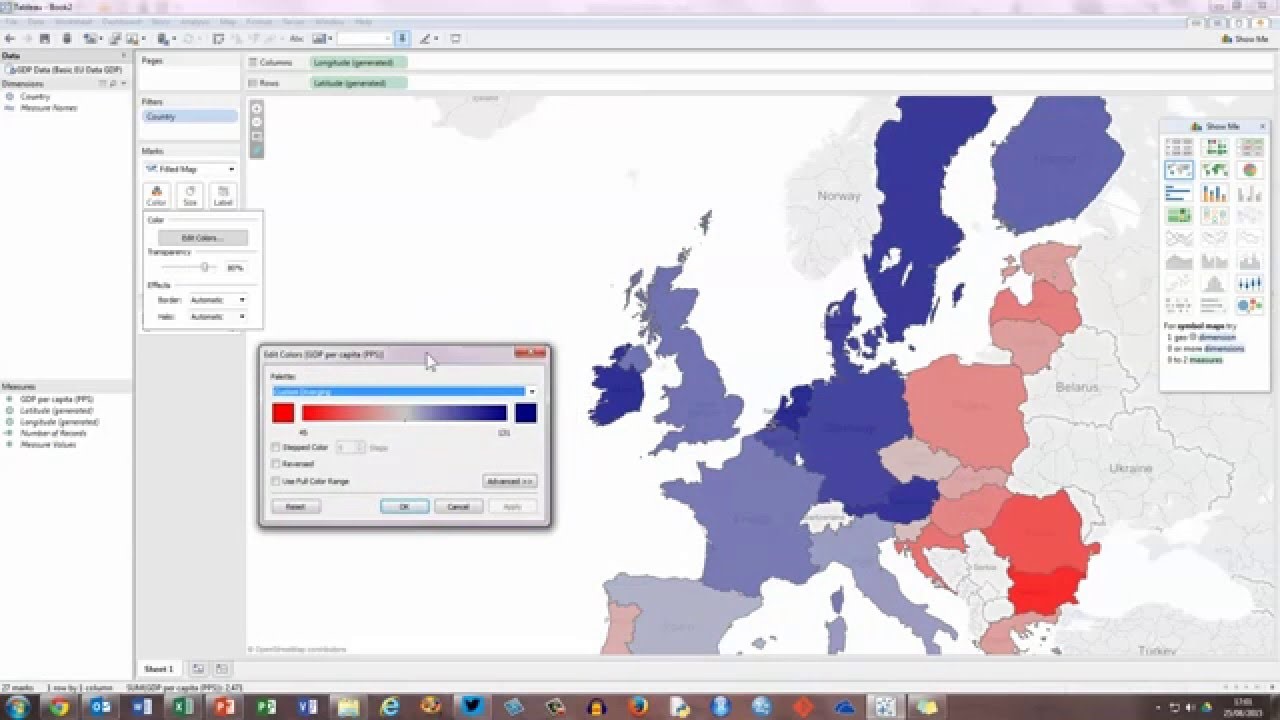
For choropleth visualizations (showing data intensity across regions), drag your key performance indicator to the color marks card. This technique excels for displaying metrics like sales performance by territory, customer density by region, or market penetration analysis:
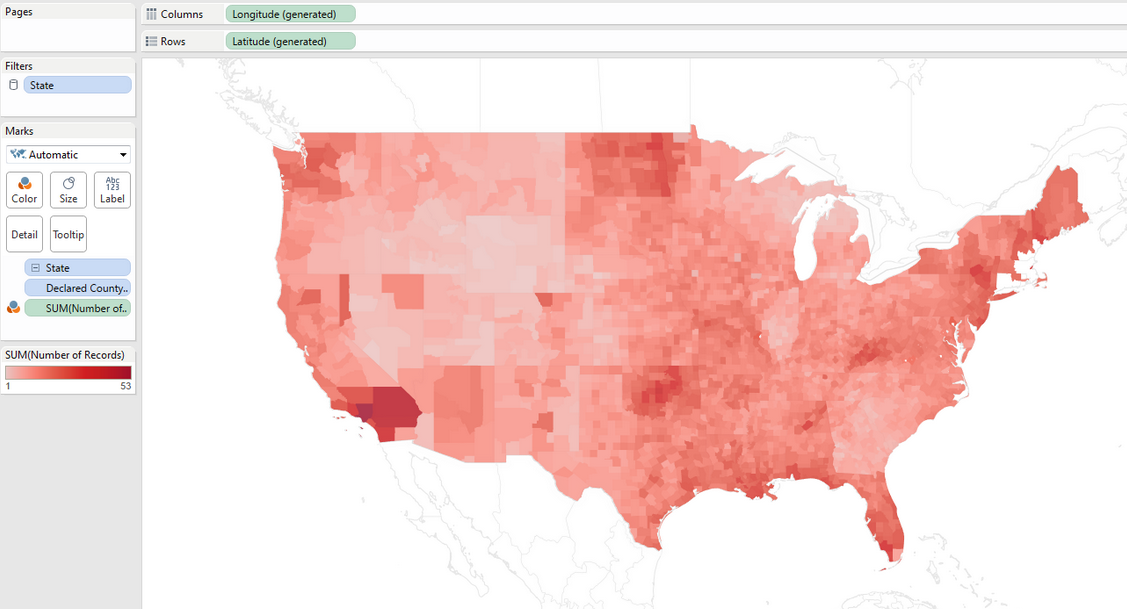
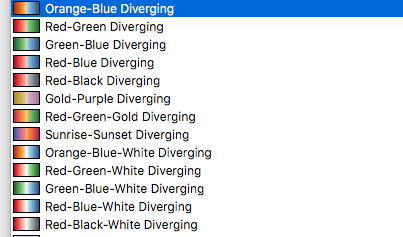
Color palette selection significantly impacts data interpretation. For metrics with natural zero points or purely positive values, monochromatic palettes work effectively. However, when your data includes meaningful negative values—such as profit/loss analysis or growth/decline metrics—diverging palettes provide clearer visual distinction:
Fine-tune your visualization by adjusting color steps to match your data's natural breaks or organizational benchmarks. This granular control helps reveal patterns that might be obscured by default settings:
![Screenshot of the 'Edit Colors [Grand Total 2014]' dialog box in Tableau (or a similar tool), showing a red color palette with stepped color set to 5 steps, an option to reverse the color range, and basic controls for applying or resetting changes.](https://www.nobledesktop.com/images/individual-polygons.png)
Advanced users can define custom value ranges to focus analysis on specific performance tiers or outlier identification. This dynamic capability allows real-time exploration of geographic patterns as you adjust parameters:
![Screenshot of the same 'Edit Colors [Grand Total 2014]' dialog box with advanced options expanded, displaying start and end values (0 to 2,502) for the red color palette, a center value of 1,000, and the stepped color option set to 5 steps.](https://www.nobledesktop.com/images/edit-colors.png)
This interactive approach proves invaluable during stakeholder presentations, allowing you to highlight different aspects of geographic performance in response to executive questions.
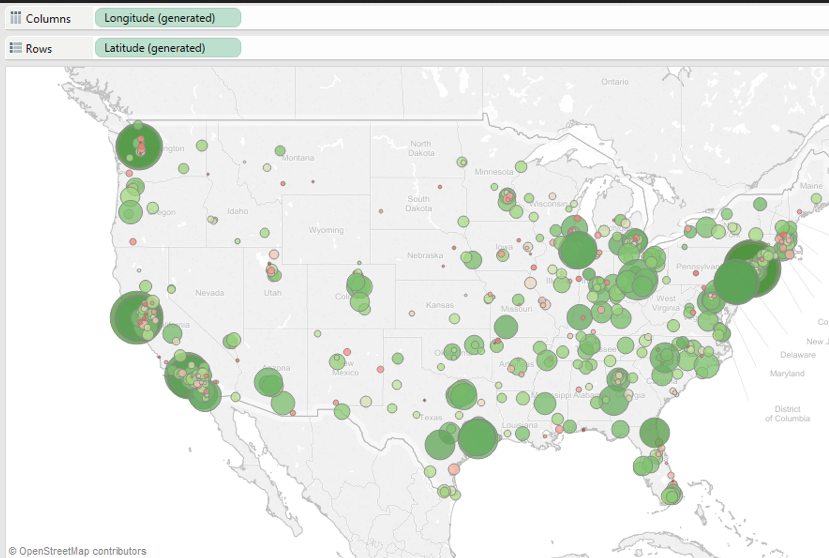
Alternative visualization strategies include using the size marks card to create proportional symbol maps, ideal for displaying absolute values like total revenue or customer count across locations:
Advanced Multi-Layer Mapping Strategies
Modern business intelligence demands sophisticated geographic analysis that can simultaneously display multiple performance indicators. Dual-axis mapping techniques enable complex comparative analysis by layering different datasets onto the same geographic foundation. This approach transforms static reporting into dynamic exploration tools.
Consider combining territorial boundaries with point-based customer data, overlaying market share percentages with competitive outlet locations, or displaying both demographic characteristics and sales performance within the same regional view. The size, color, and shape marks cards become powerful encoding tools, each capable of representing distinct business dimensions while maintaining geographic context.
For datasets of comparable magnitude requiring direct comparison, bivariate choropleth techniques offer sophisticated analytical capabilities. These specialized maps encode two variables simultaneously, revealing correlation patterns and geographic clusters that traditional single-variable maps cannot capture. We'll explore both dual-axis and bivariate approaches comprehensively in our next article, providing step-by-step implementation strategies for complex multi-dimensional geographic analysis.
Strategic Implementation Considerations
Spatial files unlock remarkable flexibility in geographic data visualization, but success requires strategic restraint. The temptation to overlay multiple datasets simultaneously can overwhelm viewers and obscure the very patterns you're trying to illuminate. Effective geographic visualization follows the principle of progressive disclosure—start with your primary insight clearly displayed, then provide interactive capabilities for deeper exploration.
Consider your audience's decision-making context. Executive dashboards benefit from clean, immediately interpretable choropleth maps highlighting performance exceptions. Operational teams may need detailed point-based maps showing individual locations with drill-down capabilities. Analytical users often require multi-layer maps with filtering and parameter controls for exploratory analysis.
As we advance into 2026, the integration of real-time data streams with spatial visualization becomes increasingly critical. Modern spatial files provide the foundation for dynamic geographic dashboards that update continuously, supporting agile business operations and rapid response to geographic market changes.