Mode Application
Imagine you're consulting for Chipotle, tasked with delivering actionable insights about customer ordering patterns and transaction values. The statistical measure you choose can dramatically impact the strategic recommendations you provide. For analyzing order size, both mean and median offer value, but the median proves superior in this context. Why? Corporate catering orders, bulk purchases for events, and occasional high-value transactions create significant outliers that would skew the mean upward, misrepresenting the typical customer experience that drives 80-90% of Chipotle's revenue.
The median gives Chipotle's executives a realistic picture of their "typical" customer transaction value—crucial for pricing strategies, promotional targeting, and location-specific inventory planning. However, when it comes to understanding menu popularity and customer preferences, neither mean nor median provides meaningful insight. This is precisely where mode becomes invaluable. By identifying the most frequently ordered items, Chipotle can optimize their supply chain, streamline kitchen operations, and develop menu innovations that align with proven customer preferences. This data-driven approach has become even more critical in 2026's competitive fast-casual landscape, where operational efficiency directly impacts profitability.
Understanding mode's practical applications is essential, but let's address the computational reality: calculating mode manually is tedious and error-prone. The traditional approach—sorting data points and manually tallying frequencies—becomes impractical with real-world datasets containing thousands of daily transactions. While we'll briefly cover the manual process for conceptual understanding, remember that modern data analysis relies on computational tools for accuracy and efficiency.
This brings us to the core focus of this tutorial: implementing mode calculation in Python. Understanding the underlying logic isn't just academic—it's essential for debugging, optimizing performance, and making informed decisions about when to use built-in libraries versus custom implementations. As we'll demonstrate, even a seemingly simple statistical measure like mode can present interesting programming challenges.
If you're new to Python programming, we recommend pausing here to build your foundational skills through a comprehensive Python Course—available both online and in-person in NYC. The following implementation deliberately avoids external libraries to illustrate the underlying logic. While this approach is more complex than using established libraries like NumPy or SciPy, it provides crucial insight into how these tools work under the hood. In subsequent articles, we'll explore how Python's rich ecosystem of libraries can streamline these calculations significantly.
*Important note: The following code prioritizes educational value over brevity. In production environments, you'd typically leverage optimized libraries. However, understanding manual implementation helps you troubleshoot library behavior, optimize for specific use cases, and make informed architectural decisions in your data analysis workflows.
Statistical Measures for Chipotle Data Analysis
| Feature | Order Size Analysis | Menu Popularity Analysis |
|---|---|---|
| Best Statistic | Median | Mode |
| Reasoning | Avoids outlier bias | Shows frequency patterns |
| Business Value | Typical order pricing | Most popular items |
| Data Type | Numerical (prices) | Categorical (menu items) |
Manual Mode Calculation vs Python Libraries
This tutorial assumes Python programming experience. Those new to Python should complete a foundational course before proceeding with statistical implementations.
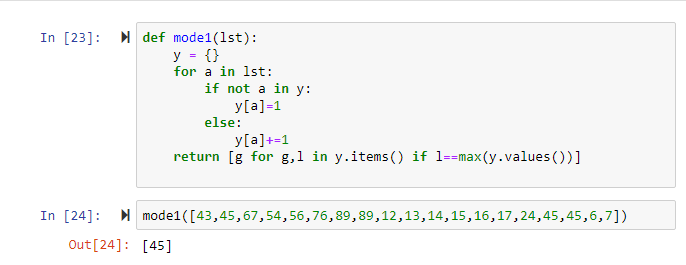
Step-by-Step Tutorial
Step 1: Create a function called mode that takes in one argument—your dataset as a list or iterable
Step 2: Initialize an empty dictionary to serve as a frequency counter for each unique value
Step 3: Implement a for-loop that iterates through each element in your input dataset
Step 4: Use conditional logic (if-else statements) to count occurrences of each unique value in the dictionary
Step 5: Return a list comprehension that identifies dictionary entries with maximum frequency values
Step 6: Test the function with sample data to verify it correctly identifies the most frequently occurring values
Building a Mode Function in Python
Function Definition
Create a function called mode that accepts one argument representing the dataset to analyze
Dictionary Initialization
Create an empty dictionary variable to store frequency counts for each data point
Data Iteration
Implement a for-loop that iterates through each element in the argument variable
Frequency Counting
Use if-not loop and else combination to count occurrences of each value in the dataset
Mode Identification
Return a list comprehension that processes the dictionary and identifies the most frequently occurring value
Function Testing
Call the function with a list of numbers to verify it correctly returns the mode of the dataset
Implementation Checklist
Ensures proper parameter handling for dataset input
Provides storage structure for frequency tracking
Ensures all data points are processed correctly
Tracks occurrence of each unique value
Finds and returns the most frequent value
Validates function works correctly with real datasets
While this manual implementation is complex for a simple problem, understanding the underlying logic prepares you to effectively use and troubleshoot statistical libraries in production code.