In this comprehensive three-part series, we'll explore the fundamental concepts of mean, median, and mode—the cornerstone measures of central tendency in data analysis. Beyond simply explaining how to calculate these statistics, we'll examine the strategic reasoning behind their use, their real-world applications in professional settings, and demonstrate efficient implementation using Python. While all three measures help identify the central tendency within datasets, each employs distinct methodologies with unique advantages and limitations that every data professional should understand.
Basics of Mean
The arithmetic mean—commonly called the average—represents one of the most intuitive yet powerful statistical concepts in data analysis. While you likely encountered this concept in school, understanding its professional applications reveals why it remains indispensable across industries in 2026. The mean serves as a comprehensive summary statistic because it incorporates every data point in your dataset, providing a single value that represents the collective behavior of your entire sample.
Consider a portfolio manager overseeing 25 investment positions who needs to quickly assess overall fund performance for quarterly reporting. Rather than analyzing each individual holding, the mean return provides an immediate snapshot of aggregate performance. This efficiency makes the mean invaluable in business intelligence, financial analysis, and performance monitoring across virtually every sector.
However, the mean's greatest strength—its sensitivity to all data points—also represents its primary vulnerability. Outliers can dramatically distort the mean, potentially leading to misleading conclusions. In our investment example, imagine 24 positions lost 5% each while one exceptional investment gained 300%. The resulting positive mean return would suggest strong overall performance despite the fund's actually poor track record, demonstrating why sophisticated analysts never rely on mean alone for critical decisions.
Investment funds use mean calculations to quickly assess portfolio performance across 25 or more current investments without analyzing each one individually.
Mean as a Statistical Measure
Finding the Mean: Tutorial
Calculating the mean involves a straightforward two-step mathematical process: sum all values in your dataset, then divide by the total count of observations. While this fundamental understanding remains crucial for data literacy, modern Python implementations handle the computational heavy lifting with remarkable efficiency.
The following tutorial demonstrates both the mathematical foundation and practical Python implementation using a real-world scenario—analyzing student test scores for academic performance assessment.
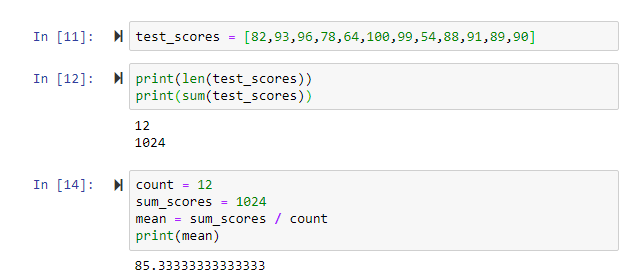
Step 1: Create a variable named test_scores and populate it with a list of individual test scores representing your dataset.
Step 2: Utilize Python's built-in len() function to count the total data points in test_scores and the sum() function to calculate the aggregate of all scores—these correspond directly to our mathematical requirements of count and sum.
Step 3: Store the count value (12 observations from our len() function) and sum value (1024 total points from our sum() function) in separate variables for clarity and debugging purposes.
Step 4: Execute the mean calculation by dividing sum by count, then output the result using Python's print function to display the final average score.
This foundational approach scales seamlessly from small datasets to enterprise-level analytics, making it an essential skill for data professionals across all experience levels. As we progress through this series, you'll discover how median and mode complement the mean to provide more robust analytical insights.
Note: If you are new to Python or need to brush up on some skills check out our Python Classes that are offered in-person or live online.
Mathematical Mean Calculation Process
Sum All Values
Add up every single data point in your dataset to get the total sum of all numbers.
Count Data Points
Determine how many individual values are present in your dataset for the division step.
Divide Sum by Count
Perform the final calculation by dividing the total sum by the number of data points to get the mean.
Python Implementation Steps
Create Test Scores Variable
Initialize a variable named test_scores and populate it with a list containing individual test score values.
Use Built-in Functions
Apply the len attribute to count data points and sum attribute to calculate total of all scores in test_scores.
Store Intermediate Values
Create count variable equal to 12 from len function and sum_scores variable equal to 1024 from sum function.
Calculate and Display Result
Divide sum by count to find the mean, then use print function to display the calculated output to the user.
Sample Calculation Values