After exploring the mean, let's examine another fundamental measure of central tendency: the median. The median represents the middle value in a dataset when arranged in ascending or descending order. While calculating the median can range from a simple hand calculation for small datasets to a complex, error-prone process for larger ones, understanding this statistic is crucial for accurate data analysis. The calculation differs slightly depending on whether your dataset contains an odd or even number of values—with even-numbered datasets requiring you to average the two middle values after systematically eliminating outer values. Fortunately, straightforward formulas and modern programming tools eliminate much of this computational complexity.
The Use for the Median
Before diving into median calculations, it's essential to understand why this statistic deserves a place in your analytical toolkit. While means (averages) dominate everyday discourse and academic settings, the median offers superior insights in specific scenarios—particularly when analyzing income distributions, real estate prices, and other datasets prone to extreme values. This preference for means over medians often stems from computational convenience rather than analytical superiority. However, the median frequently provides a more accurate representation of data, especially when Python handles the heavy computational lifting. In today's data-driven landscape, the median serves as a more robust summary metric for decision-making.
The median's greatest strength lies in its immunity to outliers and resistance to skewed distributions. Unlike the mean, which can be dramatically influenced by extreme values, the median remains stable and representative of the central tendency. Consider this practical example: a class of 11 students receives the following grades: 44, 65, 88, 89, 92, 94, 95, 96, 99, 99, 100. Using the cross-out method (systematically eliminating values from both ends), we find the median is 94, while the mean equals 87. The median of 94 better reflects the reality that nine of eleven students performed exceptionally well, with only two poor performances. The mean of 87 suggests moderate class-wide performance, masking the true distribution of success. This distinction becomes critical in professional contexts where accurate data interpretation drives strategic decisions.
For larger datasets where manual ordering and elimination become impractical and error-prone, a reliable three-step formula streamlines median calculation. First, arrange your data in ascending or descending order. Second, count the total number of data points (n = 11 in our example). Third, apply the position formula: (n + 1) ÷ 2. This formula yields the median's position within your ordered list, not the median value itself. In our grades example, (11 + 1) ÷ 2 = 6, indicating the median is the 6th value: 94. When this calculation produces a decimal (such as 6.5), average the values in the surrounding positions (6th and 7th in this case).
Student Grades Distribution Example
Class Performance Comparison
The median is actually a better measurement of data than the mean, at least in a majority of cases.Median in Python
Now that you understand both the conceptual foundation and practical applications of median calculations, let's explore Python implementation. Mastering the manual calculation process remains important because it helps you understand what Python executes behind the scenes—a crucial skill for debugging and validating results in professional environments. The following example demonstrates median calculation using standard Python with list data structures. While we'll cover more efficient pandas DataFrame methods in upcoming articles, this foundational approach works universally across Python environments. If concepts like DataFrames or pandas seem unfamiliar, consider enrolling in comprehensive Python Courses or Data Science Classes, available both in-person in NYC and through live online instruction.
Python Median Calculation Methods
Vanilla Python
Using built-in functions like sorted() and len() with lists. Requires manual implementation of median logic. Good for learning fundamentals.
Pandas DataFrame
Simple .median() method on DataFrame columns. Requires pandas import but handles complex datasets efficiently. Covered in advanced articles.
Always master the mathematical concept by hand since Python does the calculation behind the scenes. Understanding the logic helps debug and validate results.
Median Tutorial
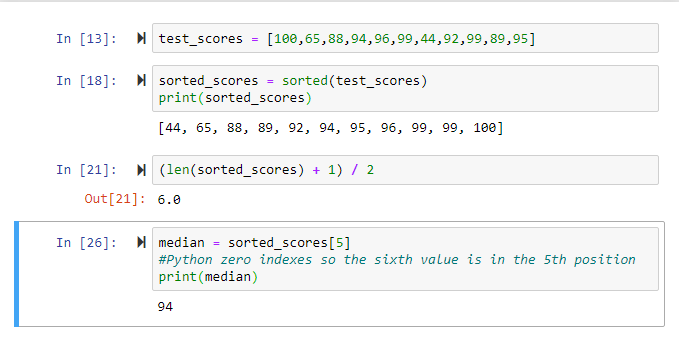
Step 1: Create a variable named test_scores and populate it with a list of individual test scores. This establishes your raw dataset for analysis.
Step 2: Create a variable named sorted_scores and set it equal to sorted(test_scores). The sorted() function arranges your test scores in ascending order, which is essential for accurate median calculation.
Step 3: Apply the len() function to sorted_scores to determine the number of values in your list, then implement our median position formula: (len(sorted_scores) + 1) / 2. This calculation identifies the median's position within your ordered dataset.
Step 4: Use the result from Step 3 as an index for your sorted_scores list. Remember that Python uses zero-based indexing, so subtract 1 from your position result. For example, if your calculation yields position 6, access sorted_scores[5] to retrieve the 6th element. Assign this value to a median variable and display the result using print().
Python Median Calculation Process
Create Test Data
Create a variable named test_scores and populate it with a list of individual test scores for your dataset.
Sort the Dataset
Create sorted_scores variable using sorted(test_scores) function to arrange values from smallest to largest.
Calculate Position
Use len() on sorted_scores, add 1, and divide by 2 to find the median position using the standard formula.
Extract Median Value
Use the calculated position with zero-based indexing (position-1) to get sorted_scores[index] and assign to median variable.
Python uses zero-based indexing, so the sixth position in your ordered list is actually index [5]. Always subtract 1 from your calculated position.
Median Calculation Checklist
Use sorted() function to ensure smallest to largest arrangement
Use len() function to avoid manual counting errors
Formula: (number of data points + 1) / 2
Average the two middle values when position is decimal
Subtract 1 from calculated position for array access