Sample Python Code for Standard Deviation
Python Standard Deviation Implementation Steps
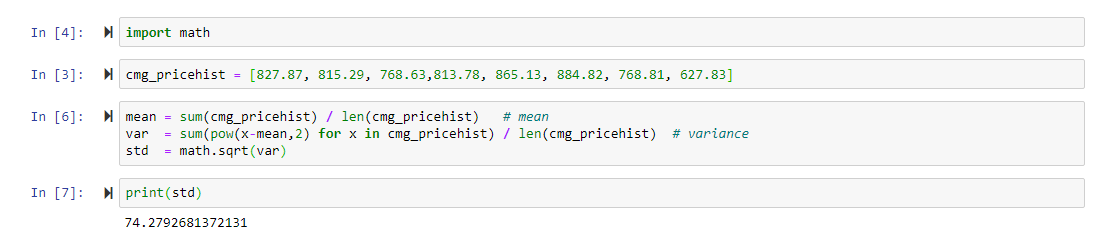
Import math package
Import the built-in math package that comes with basic Python build for mathematical operations
Create data list
Create cmg_pricehist list with eight closing values of Chipotle's stock prices
Calculate mean
Create mean variable by taking sum of data points divided by length of list
Calculate variance
Use sum and power functions with list comprehension to calculate variance numerator
Apply square root
Use math.sqrt function on variance to get final standard deviation result
Output results
Print the calculated standard deviation variable to analyze stock volatility
Writing a standard deviation function using only Python code without packages is virtually impossible for beginner and intermediate programmers. Python's math package simplifies complex statistical calculations significantly.
Standard Deviation Explained
Let's examine a concrete example using test scores: 83, 85, 87, 89, 91, 93, 95, 97, 99, 100. The average of these scores is 91.9, with a standard deviation of approximately 5.5. But what does this 5.5 actually reveal about our data distribution?
The standard deviation of 5.5 quantifies how much individual scores deviate from the mean—and in this case, it's relatively low. This tells us the data clusters tightly around the average with minimal outliers, indicating consistent performance across the group. In professional contexts, this type of distribution suggests predictable, stable patterns—whether you're analyzing employee performance metrics, quality control measurements, or financial returns.
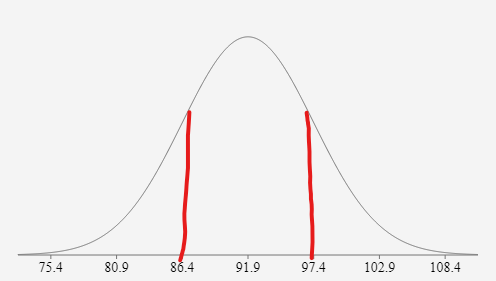
The bell curve above visualizes our test score distribution, with the peak centered at our mean of 91.9. The red lines mark one standard deviation in each direction: 97.4 (91.9 + 5.5) and 86.4 (91.9 - 5.5). Extending further, two standard deviations span from 80.9 to 102.9, while three standard deviations reach from 75.4 to 108.4.
Notice that some of these calculated boundaries fall outside our original dataset—this is intentional and mathematically necessary for constructing the bell curve. The curve represents the theoretical distribution pattern, allowing us to make statistical inferences about the broader population from which our sample was drawn. This principle underlies everything from A/B testing in marketing to risk assessment in finance.
Now that we understand what standard deviation represents visually, let's examine how to calculate it. The mathematical foundation requires familiarity with statistical notation, but don't let the Greek letters intimidate you—each symbol serves a specific, logical purpose.
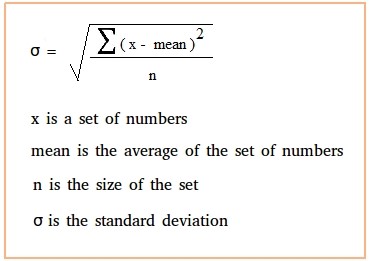
The formula above breaks down as follows: the lowercase sigma (σ) represents standard deviation, calculated as the square root of variance. The uppercase sigma (Σ) indicates summation across all data points. For each data point (X), we subtract the mean, square the result (eliminating negative values), sum all squared differences, divide by the dataset size, and finally take the square root.
This multi-step process becomes computationally intensive with large datasets, making manual calculation impractical for real-world applications. Fortunately, Python excels at these repetitive mathematical operations, transforming what would be hours of manual work into milliseconds of processing time.
While building a standard deviation function from scratch provides valuable learning, it's unnecessarily complex for practical applications. Python's ecosystem offers robust statistical packages—NumPy for numerical computing, Pandas for data manipulation, and SciPy for advanced statistics. For our demonstration, we'll use Python's built-in math package, which provides essential mathematical functions without additional installations.
*Our code example uses Chipotle's stock data (CMG) because standard deviation serves as a crucial volatility indicator in financial analysis. The prices represent actual month-end closing values over eight consecutive months, demonstrating how professionals assess investment risk through statistical measures.
Step 1: Import the math package to access statistical functions
Step 2: Create a list called cmg_pricehist containing eight closing prices from Chipotle's stock
Step 3: Calculate the mean by summing all prices and dividing by the list length
Step 4: Compute variance using sum(pow(X-mean, 2)) with list comprehension to iterate through each price point, applying the power function to squared differences
Step 5: Calculate standard deviation using math.sqrt(var) to find the square root of variance
Step 6: Output the standard deviation value for analysis
With your calculated standard deviation in hand, consider this question: Based on the price volatility revealed by your analysis, would you classify Chipotle as a high-risk or stable investment opportunity? This type of quantitative assessment forms the backbone of modern portfolio management and risk assessment strategies.
Test Score Distribution Analysis
Standard Deviation Calculations
One Standard Deviation
Adding 5.5 to mean gives 97.4, subtracting gives 86.4. This represents the first deviation boundary from the central mean value.
Two Standard Deviations
Mean plus/minus 2 times 5.5 gives range of 80.9 to 102.9. This extends the boundary to capture more data points.
Three Standard Deviations
Mean plus/minus 3 times 5.5 gives range of 75.4 to 108.4. This creates the full bell curve distribution model.
The number 5.5 shows us how the numbers are spread out from the mean and 5.5 is a relatively low standard deviation score.Bell curves are built by adding and subtracting standard deviation values from the mean. The actual dataset doesn't need to contain these calculated boundary values - they represent the mathematical distribution model.
See Our Python and Related Programs:
Python Packages for Statistical Analysis
| Feature | Math Package | Advanced Packages |
|---|---|---|
| Complexity | Multiple steps | Single operations |
| Installation | Built-in | Requires import |
| Functionality | Basic math | Comprehensive stats |
| Best for | Beginners | Data scientists |
Next Steps for Python Statistical Analysis
Use stock price data like Chipotle example to understand volatility analysis
These packages offer more efficient statistical calculations than basic math package
Use Matplotlib to create bell curves and distribution charts for your data
Understand variance, correlation, and regression analysis for comprehensive data science