Python Code Screenshot
While variance and standard deviation measure average variability across a dataset, they don't tell the complete story of data distribution. Range, IQR (Interquartile Range), and percentiles offer a different perspective—they're summary measures that reveal how data spreads across specific segments, making them invaluable for understanding outliers, data concentration, and relative positioning. These metrics also provide computational advantages, serving as efficient shortcuts for assessing data dispersion without complex calculations. For data professionals in 2026, mastering these fundamental concepts remains essential for exploratory data analysis and communicating insights to stakeholders.
Range
Range represents the simplest measure of variability: the difference between a dataset's maximum and minimum values. Consider this dataset: 1,3,3,3,4,5,4,5,10. The range equals (10-1) = 9. However, if we replace that 10 with 1,000, our range jumps to 999—a dramatic shift that illustrates range's critical weakness.
This extreme sensitivity to outliers makes range unreliable for most analytical purposes. A single anomalous value can completely distort your understanding of data spread, while the range provides no insight into how the remaining 99% of values cluster. In professional data analysis, range serves primarily as a quick sanity check or as context for more robust measures. Understanding its limitations helps explain why statisticians developed more sophisticated alternatives like percentiles and IQR.
Range Sensitivity to Outliers
| Feature | Original Dataset | With Outlier |
|---|---|---|
| Dataset | 1,3,3,3,4,5,4,5,10 | 1,3,3,3,4,5,4,5,1000 |
| Min Value | 1 | 1 |
| Max Value | 10 | 1000 |
| Range | 9 | 999 |
Range provides minimal insight into data distribution and clustering. A single outlier can dramatically skew the range value, making it unreliable for most statistical analyses.
Percentile
Percentiles transform raw data points into relative positions, making them particularly powerful for comparative analysis. When we say "Ben scored in the 75th percentile on the SATs," we're not describing his raw score—we're revealing that he outperformed 75% of test-takers while trailing the top 25%. This relative positioning makes percentiles invaluable across industries, from performance benchmarking in business to growth charts in healthcare.
The median, which you've likely encountered, is simply the 50th percentile—the value that splits your dataset in half. This connection highlights percentiles' intuitive nature: they divide data into meaningful segments that reveal distribution patterns.
Calculating percentiles follows a systematic approach. First, sort your dataset from smallest to largest. Next, multiply the total number of values by your desired percentile (expressed as a decimal). This gives you an index position. If the result isn't a whole number, round up to the next integer. Finally, count from left to right in your sorted dataset until you reach that index position. Remember that Python uses zero-based indexing, so subtract 1 from your calculated index to avoid off-by-one errors that can plague even experienced developers.
Ben scored in the 75th percentile on the SATsUnderstanding Percentile Concepts
Relative Measurement
Percentiles show position relative to other data points, not absolute values or rankings.
Median Connection
The median is the 50th percentile - the value that splits the dataset in half.
Ordering Required
Data must be sorted from smallest to largest before calculating percentiles.
IQR
The Interquartile Range (IQR) represents the statistical sweet spot for measuring variability. By calculating the difference between the 75th percentile (Q3) and the 25th percentile (Q1), IQR focuses on the middle 50% of your data—effectively filtering out extreme outliers that can skew other measures.
This robustness makes IQR particularly valuable in real-world data analysis, where outliers are common and often misleading. Financial analysts use IQR to understand typical performance ranges while ignoring exceptional gains or losses. Data scientists rely on IQR for outlier detection algorithms. The measure provides a stable foundation for understanding data concentration without the volatility that affects range or the complexity that can make standard deviation harder to interpret for non-technical stakeholders.
IQR Components
IQR vs Range Comparison
Step-by-Step Tutorial
Let's implement these concepts in Python using core language features. While libraries like NumPy offer built-in functions, understanding the underlying mechanics will deepen your statistical intuition and prove invaluable when you need custom implementations or want to explain your methodology to others.
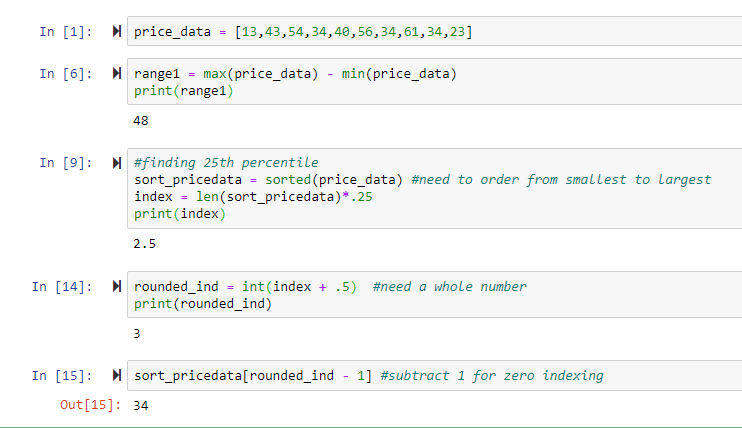
Step 1: Create a list called price_data and populate it with your sample values. This forms your working dataset.
Step 2: Create a variable called range1 and set it equal to the difference between max(price_data) and min(price_data). Print this value to understand your data's total spread.
Step 3: Create sort_pricedata by calling sorted(price_data). This ascending order is crucial for accurate percentile calculations.
Step 4: Calculate your index by multiplying len(sort_pricedata) by 0.25 (for the 25th percentile). Print this value to check whether it's a whole number, as this affects your next step.
Step 5: Create rounded_int by adding 0.5 to your index and converting to an integer. This ensures proper rounding behavior.
Step 6: Access your 25th percentile by indexing sort_pricedata[rounded_int - 1]. The subtraction adjusts for Python's zero-based indexing.
*Bonus Exercise: Apply this same methodology to find the 75th percentile, then subtract your 25th percentile result to calculate the IQR. This hands-on practice solidifies your understanding of how these measures interconnect.
Python Implementation Steps
Create Dataset
Initialize a list called price_data with your numerical values for analysis
Calculate Range
Create range1 variable as max(dataset) - min(dataset) and print the result
Sort Data
Create sort_pricedata using sorted(price_data) to order values from smallest to largest
Find Index
Calculate index = length of data × desired percentile (e.g., 0.25 for 25th percentile)
Round Index
Create rounded_int by adding 0.5 to index to round up to nearest whole integer
Get Percentile Value
Index sort_pricedata[rounded_int - 1] to adjust for zero-based indexing
Python uses zero-based indexing, which can lead to off-by-one errors when calculating percentiles. Always subtract 1 from your calculated index position.
Next Steps in Your Data Science Journey
Build object-oriented programming skills for complex data structures
Formal education provides structured learning and industry recognition
Intensive hands-on training accelerates practical skill development
Practice with actual data reinforces theoretical knowledge