Topics Covered in This JavaScript & jQuery Tutorial:
Master Chrome's DevTools for debugging, select HTML elements with getElementById(), manipulate DOM elements dynamically, and control element properties and values programmatically.
Exercise Preview
This hands-on exercise teaches JavaScript DOM manipulation through Chrome's DevTools Console. You'll learn to select, modify, and control HTML elements dynamically without writing permanent code.
Exercise Overview
In this hands-on exercise, we'll demystify JavaScript's DOM manipulation capabilities by diving into the browser's inner workings. Using Chrome's industry-standard DevTools, we'll explore the HTML document structure, select specific elements, and modify them in real-time using JavaScript. This foundational skill is essential for any developer working with interactive web applications, as it demonstrates the core principles behind dynamic user interfaces and data manipulation.
Getting Started
We'll begin by setting up our development environment and familiarizing ourselves with Chrome's powerful debugging tools—skills that remain fundamental to web development in 2026.
- On your Desktop, navigate into Class Files > yourname-JavaScript jQuery Class > Form-Fields folder.
- We want to use Chrome's comprehensive Developer Tools (DevTools), so we'll open our page in Chrome. CTRL–click (Mac) or Right–click (Windows) on form.html and choose Open With > Google Chrome.
- CTRL–click (Mac) or Right–click (Windows) anywhere on the page and choose Inspect from the menu. Alternatively, you can use the keyboard shortcut F12 or Cmd+Option+I (Mac).
- Chrome's DevTools now opens, revealing the browser's diagnostic interface. Every modern browser includes similar developer tools, but Chrome's implementation remains the industry gold standard for debugging, performance analysis, and DOM inspection. Here, you can diagnose issues, monitor network activity, analyze performance bottlenecks, and examine all HTML, CSS, and JavaScript that the browser processes.
The DevTools interface organizes its functionality into tabbed panels, with the Elements panel open by default. This panel provides real-time access to the Document Object Model (DOM).
In the Elements tab, you can inspect any HTML element and view its complete markup, computed styles, and event listeners. Hover your mouse over any line of HTML code—notice how the corresponding element highlights in the browser window with colored overlays showing padding, margins, and borders. This visual feedback is invaluable for understanding layout relationships and debugging positioning issues.
- At the top left of the DevTools window, click the
 element selector button. This activates inspection mode—when you hover over any element in the actual webpage, the corresponding HTML code highlights automatically in DevTools, streamlining the process of locating specific elements in complex documents.
 - Click the button again to deactivate inspection mode.
At the top of the DevTools window, click on the Console tab to access JavaScript's interactive environment.
The Console serves dual purposes: it displays JavaScript errors, warnings, and log messages from your application, and provides an interactive JavaScript environment where you can execute code in real-time. This makes it an indispensable tool for testing code snippets, debugging functions, and experimenting with DOM manipulation without modifying your source files.
- In the Console, type
alert('Hello');and press Return (Mac) or Enter (Windows). This demonstrates the Console's ability to execute JavaScript immediately. - A browser alert dialog displaying Hello appears. Click OK to dismiss it.
The Console enables temporary modifications to any HTML page you're viewing—even live production websites. This capability makes it perfect for rapid prototyping and testing hypotheses about how changes might affect user experience.
Type document into the Console and press Return (Mac) or Enter (Windows). The
documentobject represents the entire HTML document and serves as the entry point for all DOM manipulation.- The Console returns #document. Hover over this text and observe how the entire webpage highlights, indicating that
documentencompasses all page content. - Click the arrow next to #document to expand its structure. This reveals the complete DOM tree hierarchy, showing how browsers internally organize HTML into a navigable object structure.
- Click the arrow next to
<body>to expand it and examine all body contents. This tree structure mirrors your HTML source code but reflects the browser's live interpretation, including any dynamic changes. Hover over various elements within the
<body>section and notice how each content block highlights in the browser window, demonstrating the direct relationship between DOM objects and visual elements.
DevTools Setup Process
Open File in Chrome
Navigate to form.html in the Form-Fields folder and open with Google Chrome browser
Launch DevTools
Right-click anywhere on the page and select 'Inspect' from the context menu
Explore Elements Panel
Use the Elements tab to inspect HTML markup and hover over elements to see highlights
Access Console
Switch to the Console tab where you'll execute JavaScript commands for testing
Use the element selector button in DevTools to click on page elements and automatically highlight their corresponding HTML code. This makes it easy to find the exact markup you want to modify.
Selecting & Working with HTML Elements
Now that we understand the document structure, let's explore targeted element selection—a cornerstone skill for building interactive applications. Rather than manipulating entire documents, professional developers work with specific elements using precise selection methods.
- At the top left of the DevTools window, click the element selector button to reactivate inspection mode.
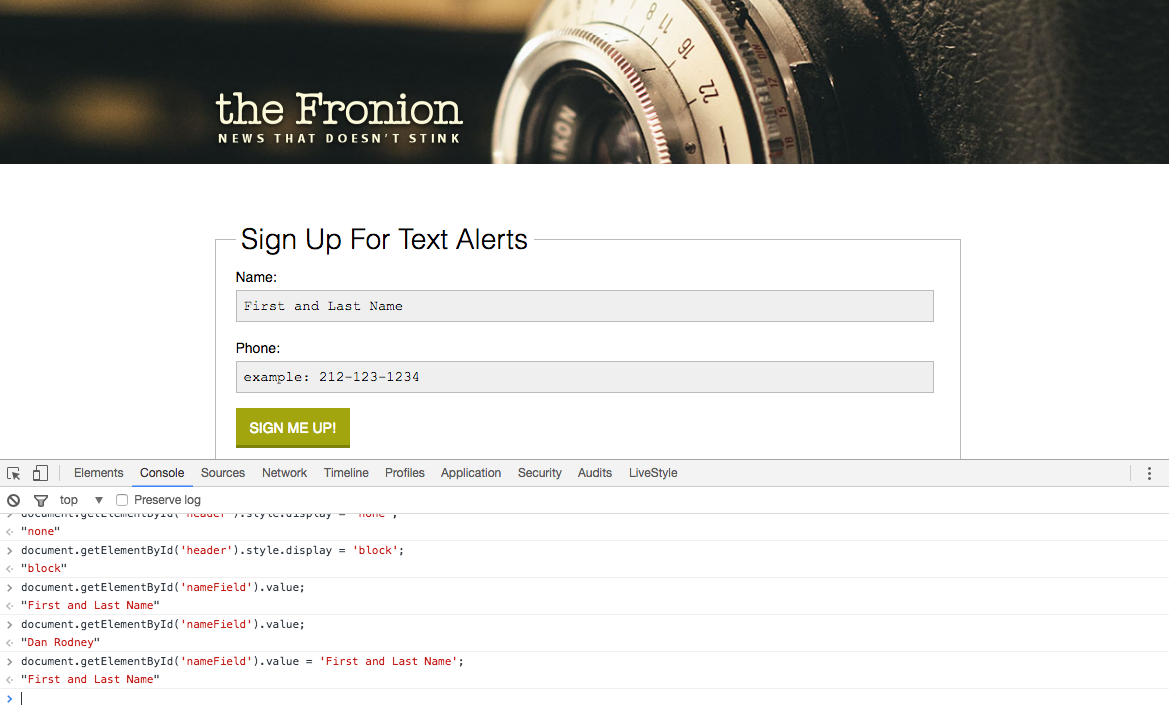
- In the webpage, click on the text field labeled Name. This demonstrates how to identify specific elements for JavaScript targeting.
- In DevTools, observe that the input element with ID nameField becomes highlighted in the Elements panel. This ID attribute serves as a unique identifier that JavaScript can reference.
In DevTools, click on the Console tab to return to the JavaScript environment.
In the Console, type
document.getElementById('nameField');“document.getElementById('nameField')
The fundamental JavaScript method for targeting specific HTML elements by their unique ID attribute. This becomes the foundation for all DOM manipulation.DOM Selection Concepts
Document Object
Represents the entire HTML page structure. Type 'document' in Console to see the complete page hierarchy and explore its contents.
Element Targeting
Use getElementById() with dot syntax to select specific elements by their ID attribute for precise manipulation and control.
About getElementById()
The getElementById() method represents one of the most fundamental DOM selection techniques, allowing precise targeting of any HTML element via its unique ID attribute. Critical note: the method name uses specific capitalization—Id—that must be exact for proper function execution. Writing getElementByID() with an uppercase "ID" will result in a method-not-found error, a common mistake that trips up developers at all skill levels.
The Console displays <input id="nameField … value="First and Last Name">, representing the complete element object.
Hover over this output and notice that only the nameField input highlights in the webpage. This confirms successful element selection. We can now access this element's properties and methods using JavaScript's dot notation syntax—a pattern you'll use constantly in professional development.
Extend the previous command by adding the following bold code:
document.getElementById('nameField').style.display = 'none';This statement chains two operations: first, it selects the element with ID nameField, then accesses its CSS display property and sets it to 'none', effectively hiding the element. Note that CSS property values must be provided as strings in JavaScript.
Modify the display value as shown in bold:
document.getElementById('nameField').style.display = 'block';Press Return (Mac) or Enter (Windows). The input reappears, confirming your ability to control element visibility programmatically.
The method must be written as getElementById() with exact capitalization. Writing getElementByID() with capital 'ID' will cause the function to fail completely.
getElementById() Method Analysis
Getting & Setting Input Values
Input elements form the backbone of user interaction in web applications. Understanding how to programmatically read and modify their values enables dynamic form processing, real-time validation, and sophisticated user interface behaviors that modern applications demand.
Type the following command into the Console:
document.getElementById('nameField').value;- The Console returns "First and Last Name"—the current text content of the input field. This demonstrates how JavaScript reads user input programmatically.
- Let's observe dynamic value changes. Click into the Name field in the webpage and replace the placeholder text with your actual name.
- Return to the Console to test JavaScript's ability to detect this user input change.
- Press the Up Arrow key to recall the value-reading command.
- Press Return (Mac) or Enter (Windows) to re-execute the command.
- The Console now displays your entered name, confirming that JavaScript can access real-time user input—a capability essential for form validation, search suggestions, and interactive features.
- JavaScript can also programmatically modify input values, enabling features like auto-completion, form pre-population, and data formatting. Press the Up Arrow key again to recall the previous command.
Modify the command to assign a new value, as shown in bold:
document.getElementById('nameField').value = 'example: John Doe';- Press Return (Mac) or Enter (Windows) to execute the assignment.
- The text field now displays example: John Doe, demonstrating programmatic value setting—useful for providing examples, clearing forms, or implementing undo/redo functionality.
Remember that Console-based changes are temporary and development-focused. Click the browser's Reload button to confirm that your experimental changes disappear, returning the page to its original state.
While Console modifications don't persist across page reloads, this interactive environment provides an invaluable testing ground for developing and debugging JavaScript functionality before implementing it in your production code.
Getting vs Setting Element Values
| Feature | Getting Values | Setting Values |
|---|---|---|
| Syntax | element.value | element.value = 'new text' |
| Purpose | Read current content | Write new content |
| Return Value | Current string value | Updated element |
| Use Case | Form validation | Dynamic updates |
Value Manipulation Workflow
Select Target Element
Use document.getElementById() to target the specific input field you want to work with
Access Value Property
Add .value to read the current content or assign new content with = operator
Test Changes
Execute commands in Console to see immediate results and verify your code works correctly
Changes made in the Console are temporary and lost on page reload. This makes it perfect for testing code safely before implementing permanent solutions in your JavaScript files.